本期每周一库带来的是一个简单的数据可视化的库 - plotlib
从库的名字不难看出,言简意赅,一定程度上借鉴了python下的matplotlib的命名。
省略中间环节,直接附上库的一些链接:
plotlib是一个Rust下用于绘制通用数据的可视化的库,从库的github的介绍来看,plotlib还是处于早期。
现阶段plotlib可以实现以下功能:
- histograms
- scatter plots
- line graphs from data or from function definitions
- box plots
- bar charts
从功能来看,plotlib绘制的内容会保存为*.svg格式,并且图表中同样可以插入坐标轴备注等信息。
下面我们实现一个简单的plotlib的程序来体验一下Rust下的数据可视化
开发环境:
- OS: Windows 10
- Editor: VsCode
- Rustc version: 1.39.0
- plotlib version: 0.3.0
新建一个工程,在Cargo.toml文件的[dependencies]中写入plotlib的版本
[dependencies]
plotlib = "0.3.0"
在src/main.rs文件中写入如下代码:
use plotlib::scatter::Scatter;
use plotlib::scatter;
use plotlib::style::{Marker, Point};
use plotlib::view::View;
use plotlib::page::Page;

fn main() {
    // Scatter plots expect a list of pairs
    let data1 = [(-3.0, 2.3), (-1.6, 5.3), (0.3, 0.7), (4.3, -1.4), (6.4, 4.3), (8.5, 3.7)];

    // We create our scatter plot from the data
    let s1 = Scatter::from_vec(&data1)
        .style(scatter::Style::new()
            .marker(Marker::Square) // setting the marker to be a square
            .colour("#DD3355")); // and a custom colour

    // We can plot multiple data sets in the same view
    let data2 = [(-1.4, 2.5), (7.2, -0.3)];

    let s2 = Scatter::from_vec(&data2)
        .style(scatter::Style::new() // uses the default marker
            .colour("#35C788")); // and a different colour

    // The 'view' describes what set of data is drawn
    let v = View::new()
        .add(&s1)
        .add(&s2)
        .x_range(-5., 10.)
        .y_range(-2., 6.)
        .x_label("X轴")
        .y_label("Y轴");

    // A page with a single view is then saved to an SVG file
    Page::single(&v).save("scatter.svg");
}
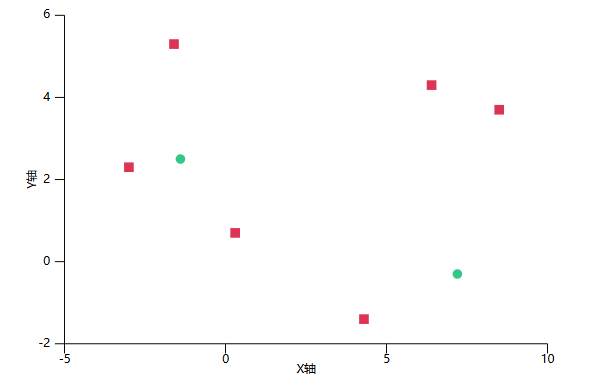
运行之后会在工程主目录下生成一个名为scatter.svg的文件。我们可以在浏览器中打开预览:

从生成的svg图片可以看出,plotlib已经提供了最基本的绘制功能,可以配置数据点的形状,颜色,时间轴备注等。基本可以满足开发中简单数据的可视化需求。
以上就是本期每周一库的内容,感谢
1
共 1 条评论, 1 页

评论区
写评论👍 一库一库